Kafka notes
kafka一些名词
Broker:消息中间件处理结点,一个Kafka节点就是一个broker,多个broker可以组成一个Kafka集群。
Topic:一类消息,例如page view日志、click日志等都可以以topic的形式存在,Kafka集群能够同时负责多个topic的分发。
Partition:topic物理上的分组,一个topic可以分为多个partition,每个partition是一个有序的队列。
Segment:partition物理上由多个segment组成,下面2.2和2.3有详细说明。
offset:每个partition都由一系列有序的、不可变的消息组成,这些消息被连续的追加到partition中;
partition中的每个消息都有一个连续的序列号叫做offset,用于partition唯一标识一条消息
producer: 生产者,负责发布信息到broker
consumer: 消费者,每个consumer都属于一个consumer group,可以指定其名字;同一个topic只能被同一个consumer group下的一个consumer消费,但是多个consumer group可以同时消费该topic
思考
作为一个消息队列,要求有哪些
- 队列(数据结构)
- 持久性(可以恢复数据),怎么存储,怎么恢复,过期的数据处理(因为不可能全部保存)
- 分布式(高可用),基于zookeeper带来的ZAB选举协议,后面会慢慢去掉该依赖
- 速度(性能) 持久化速度,网络IO速度(编码); 消费端exactly-once消费
- 如何设置相关参数?
- 其他功能? 延时队列(场景:并发量大,订单超时取消)
持久性
怎么存
通过日志存储:
Topic 包含 Parition Parition包含log
存到哪个partition呢?
可以在server.properties设置里面num.Partitions设置多个partition,存到哪个要由客户端决定
log又是怎么存的?
log实际是分为 00000000000000000000.index 00000000000000000000.log 00000000000000000000.timeindex 00000000000000000001.snapshot leader-epoch-checkpoint
存储的时机
同样可以从server.properties中看到
# Messages are immediately written to the filesystem but by default we only fsync() to sync
# the OS cache lazily. The following configurations control the flush of data to disk.
# There are a few important trade-offs here:
#    1. Durability: Unflushed data may be lost if you are not using replication.
#    2. Latency: Very large flush intervals may lead to latency spikes when the flush does occur as there will be a lot of data to flush.
#    3. Throughput: The flush is generally the most expensive operation, and a small flush interval may lead to excessive seeks.
# The settings below allow one to configure the flush policy to flush data after a period of time or
# every N messages (or both). This can be done globally and overridden on a per-topic basis.

# The number of messages to accept before forcing a flush of data to disk
#log.flush.interval.messages=10000

# The maximum amount of time a message can sit in a log before we force a flush
#log.flush.interval.ms=1000其中log.flush.interval.ms=1000 和log.flush.interval.messages=10000 就是刷盘的时机;
压缩
从文档中可以获得其设计内容:
Log compaction is handled by the log cleaner, a pool of background threads that recopy log segment files, removing records whose key appears in the head of the log. Each compactor thread works as follows: It chooses the log that has the highest ratio of log head to log tail It creates a succinct summary of the last offset for each key in the head of the log It recopies the log from beginning to end removing keys which have a later occurrence in the log. New, clean segments are swapped into the log immediately so the additional disk space required is just one additional log segment (not a fully copy of the log). The summary of the log head is essentially just a space-compact hash table. It uses exactly 24 bytes per entry. As a result with 8GB of cleaner buffer one cleaner iteration can clean around 366GB of log head (assuming 1k messages).
- 压缩由
log cleaner处理,log cleaner是一堆由后台的复制logsegment files的线程池,负责移除那些key在log头部的记录; - 每个压缩线程会选择最经常出现的记录(整个log)
- 其会 在 log的头部创建每个key的最近一次offset的summary
- 其会从头recopy相关的log到尾部,然后移除在靠后出现的keys; 新的,干净的segments会被立即替换到log(因此只需一次额外的log segment IO即可)
怎么恢复
过期删除
同样,log不可能无限增长,都设置了删除log的时机,也是由log cleaner处理,条件
# The following configurations control the disposal of log segments. The policy can
# be set to delete segments after a period of time, or after a given size has accumulated.
# A segment will be deleted whenever *either* of these criteria are met. Deletion always happens
# from the end of the log.

# The minimum age of a log file to be eligible for deletion due to age
log.retention.hours=168

# A size-based retention policy for logs. Segments are pruned from the log unless the remaining
# segments drop below log.retention.bytes. Functions independently of log.retention.hours.
#log.retention.bytes=1073741824

# The maximum size of a log segment file. When this size is reached a new log segment will be created.
log.segment.bytes=1073741824

# The interval at which log segments are checked to see if they can be deleted according
# to the retention policies
log.retention.check.interval.ms=300000
速度
网络层
使用NIO server;
zerocopy
接口是MessageSet,写入是其writeTo方法,
其不使用buffer write的原因是这个方法允许file-backed messages set去使用更加有效率的java中的FileChannel.transferTo()方法,其实际就是操作系统的sendfile()系统调用!
在kafka中用于FileRecords的writeTo()方法
@Override
public long wri teTo(GatheringByteChannel destChannel, long offset, int length) throws IOException {
    long newSize = Math.min(channel.size(), end) - start;
    int oldSize = sizeInBytes();
    if (newSize < oldSize)
        throw new KafkaException(String.format(
                "Size of FileRecords %s has been truncated during write: old size %d, new size %d",
                file.getAbsolutePath(), oldSize, newSize));

    long position = start + offset;
    int count = Math.min(length, oldSize);
    final long bytesTransferred;
    if (destChannel instanceof TransportLayer) {
        TransportLayer tl = (TransportLayer) destChannel;
        bytesTransferred = tl.transferFrom(channel, position, count);
    } else {
        //这里就是直接调用java的transferto
        bytesTransferred = channel.transferTo(position, count, destChannel);
    }
    return bytesTransferred;
}这种设计还有一种名字叫做zeroCopy:
传统read write
传统的read()大概经历了如图 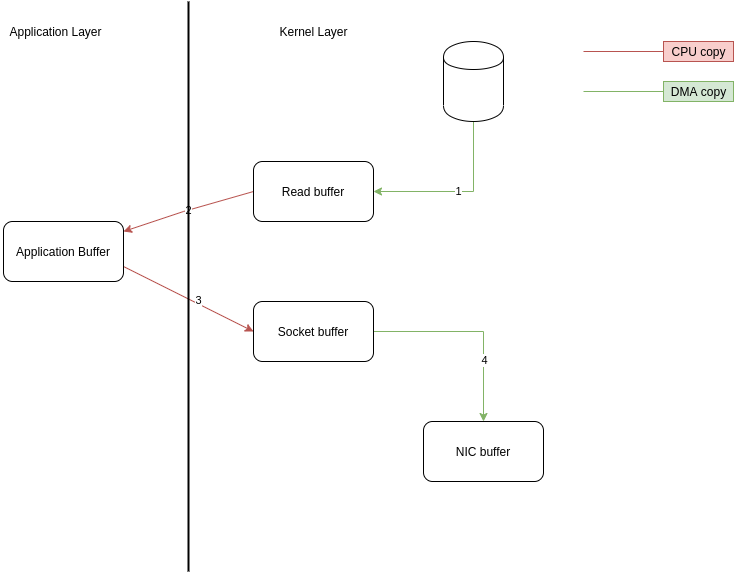
整个操作两次 cpu copy,两次 DMA copy,四次上下文切换(读两次,写两次),两次系统调用;
sendfile
而zeroCopy可以直接从内核缓冲区写入socket缓冲区,避免了普通的read()方法的各种上下文交换以及内核空间缓冲区与用户空间缓冲区的交换
改写后就会变成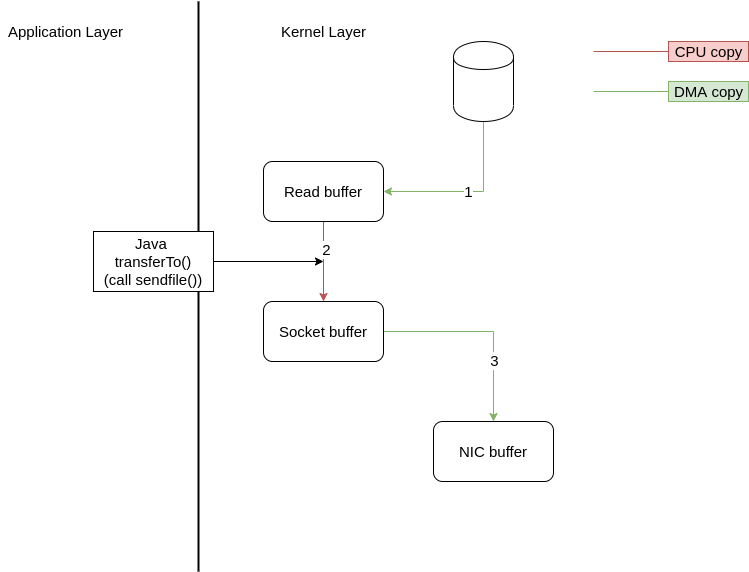
整个过程两次 DMA copy,两次上下文切换,1 次 cpu copy,一个系统调用;
Scatter/Gather DMA + sendfile
ps:看到上图,既然read buffer与socekt buffer之间还有一次CPU copy,如果我们将该copy去掉呢?
首先讲下原因: 这是因为在一般的Block DMA方式中,源物理地址和目标物理地址都得是连续的,所以一次只能传输物理上连续的一块数据,每传输一个块发起一次中断,直到传输完成,所以必须要在两个缓冲区之间拷贝数据;
而Scatter/Gather DMA方式则不同,会预先维护一个物理上不连续的块描述符的链表,描述符中包含有数据的起始地址和长度;
传输时((DMA控制器负责)只需要遍历链表,按序传输数据,全部完成后发起一次中断即可,效率比Block DMA
Block DMA: 如果在传输完一块物理上连续的数据后引起一次中断,然后再由主机进行下一块物理上连续的数据传输
要高。也就是说,硬件可以通过Scatter/Gather DMA直接从内核缓冲区中取得全部数据,不需要再从内核缓冲区向Socket缓冲区拷贝数据(再次省去了一次CPU copy)。因此上面的时序图还可以进一步简化;
如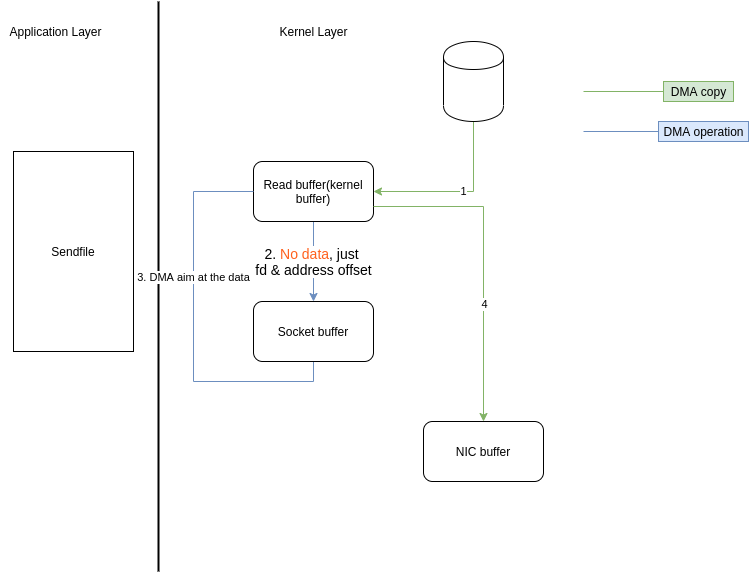
总的只需要2次上下文切换,0次CPU copy,3 次DMAcopy;
mmap/Unmap内存映射支持
上面的Scatter/gather很明显DMA从内核取得数据是不可以更改数据的,如果要修改数据,则需要内存映射的支持,可以将文件数据映射到内核地址空间,修改完后刷回去;
当然了,mmap也是系统调用,会引起上下文切换,不需要上下切换的只不过是改的过程,然后进行一次write()的调用,对应的的最后也要调用一个unmap()系统调用,所以这里总共会有六次上下文切换,
另外,还需要在TLB中维护所有数据对应的地址空间;
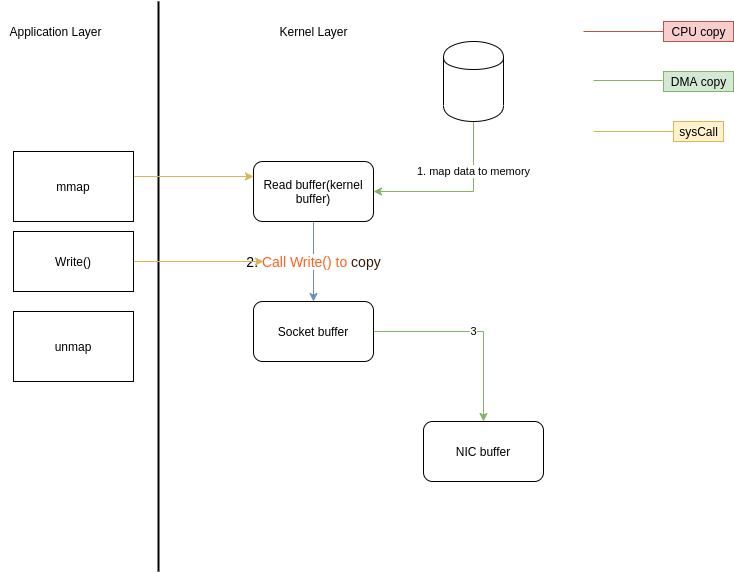
总的需要6次上下文切换,1次CPU copy,2次DMA copy
Splice
还有一种方法Splice是基于管道的,可以用于在内核区进行,同样避免了用户态切换以及CPU的copy:
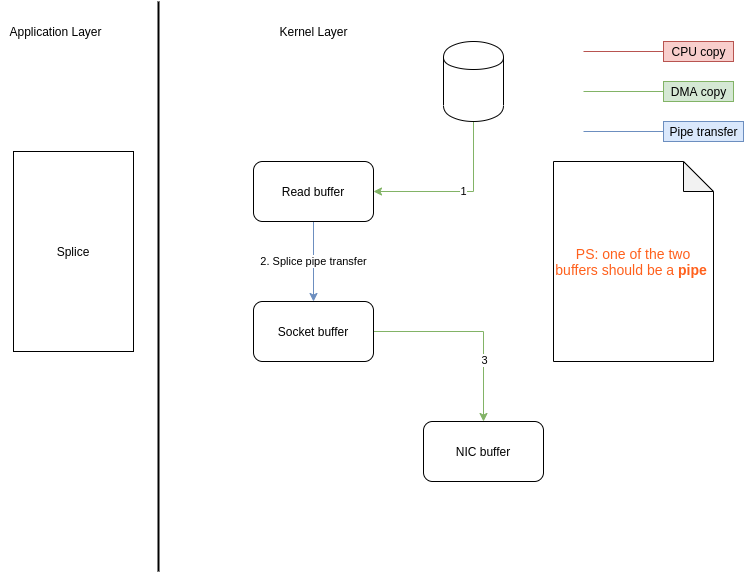
要特别注意的就是这两个buffer其中一个的fd必须是管道设备
线程设计
进程方面也是一个acceptor的线程和N个processor线程,其中processor线程都会处理固定数目的connection;
存储
顺序读写
都是append到文件中;
page cache
kafka借用了系统的page cache的来处理缓存; 原因有几点:
- 如果自己管理cache,因为其为自定义object,jvm会将其设为object overhead,浪费空间;
- JVM会有自己的GC,过大的堆也会影响GC,降低吞吐量
- 如果Kafka崩溃,在内存中的数据也会不见;
分区
topic可以分为多个partition,每个partition又可以分为多个segment,每次操作都是对小部分操作,大量减少消耗和增加并行性;
数据本身处理
批量发送
压缩
Gzip,snappy压缩数据
分布式
同步问题
主要由几点保证:
1. Replicated
ISR:In-Sync Replicated 每个Partition都有一个ISR
AR: assigned Replicated
ISR由leader维护,follower
2. HW,LEO
看几幅图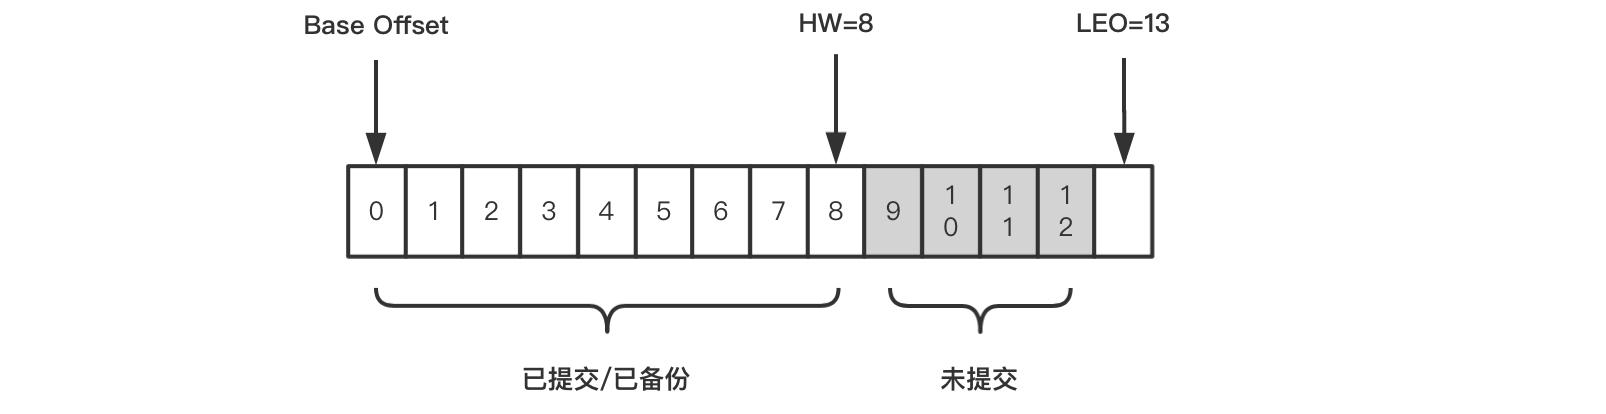
-
Base Offset: 第一条日志的offset,
-
HW: replicated的leader和follower都会有这个值,leader中的HW决定consumer可以消费到哪个offset;如图[0,8]的消息都可以被消费;
-
LEO: log end offset,即日志末端位移,代表日志文件中下一条待写入消息的offset,同样leader和follower都有该值; leader收到消息后这个值+1,但follower要从leader副本fetch到消息后才可以增加,最后leader取两者之间的LEO的最小值作为HW,更新自己的HW;
几个副本中,最旧版本offset即为High watermark,恢复数据时也以这个为准
epoch
在0.11以后的版本,新增了(Leader epoch); 解决了 宕机问题造成的offset数据不一致以及数据丢失两种问题:
- 数据丢失:
- 数据不一致:
增加了epoch,存储在leader broker上,与offset组成(epoch, offset)key-value pair,其会被定期写入一个checkpoint;
-
Leader每发生一次变化epoch就会+1,offset就代表该epoch版本的Leader写入的第一条日志的位移;
-
Leader首次写入就会增加一个记录;
3. ACK
如何设置相关参数
-
Partition数量设置最好是broker的整数倍,这样topic会平均分到每个broker相同的partitions
-
另一个需要特别注意的问题是
lagging consumer,即那些消费速率慢、明显落后的consumer; 它们要读取的数据有较大概率不在broker page cache中,因此会增加很多不必要的读盘操作; 比这更坏的是,lagging consumer读取的“冷”数据仍然会进入page cache,污染了多数正常consumer要读取的“热”数据,连带着正常consumer的性能变差; -
page_cache的设置:
/proc/sys/vm/dirty_writeback_centisecs:flush检查的周期。单位为0.01秒,默认值500,即5秒。每次检查都会按照以下三个参数控制的逻辑来处理。/proc/sys/vm/dirty_expire_centisecs:如果page cache中的页被标记为dirty的时间超过了这个值,就会被直接刷到磁盘。单位为0.01秒。默认值3000,即半分钟。/proc/sys/vm/dirty_background_ratio:如果dirty page的总大小占空闲内存量的比例超过了该值,就会在后台调度flusher线程异步写磁盘,不会阻塞当前的write()操作。默认值为10%。/proc/sys/vm/dirty_ratio:如果dirty page的总大小占总内存量的比例超过了该值,就会阻塞所有进程的write()操作,并且强制每个进程将自己的文件写入磁盘。默认值为20%。 一般可以考虑调整dirty_expire_centisecs 和 dirty_background_ratio
一些版本更替问题
主要是对zookeeper依赖问题
客户端
- Kafka 0.8时代,Kafka有3个客户端,分别是Producer、Consumer和Admin Tool;
其中Producer负责向Kafka写消息,Consumer负责从Kafka读消息,而Admin Tool执行各种运维任务,比如创建或删除主题等; 其中Consumer的位移数据保存在ZooKeeper上,因此Consumer端的位移提交和位移获取操作都需要访问ZooKeeper,另外Admin Tool执行运维操作也要访问ZooKeeper,比如在对应的ZooKeeper znode上创建一个临时节点,然后由预定义的Watch触发相应的处理逻辑。
服务端(broker)
依赖较为严重:
主要是
-Broker注册管理(靠zk的quorum) -ACL安全层配置 -动态参数管理 -ISR管理 -Controller选举
参考
本博客所有文章除特别声明外,均采用 CC BY-SA 4.0 协议 ,转载请注明出处!